![]()
![]()
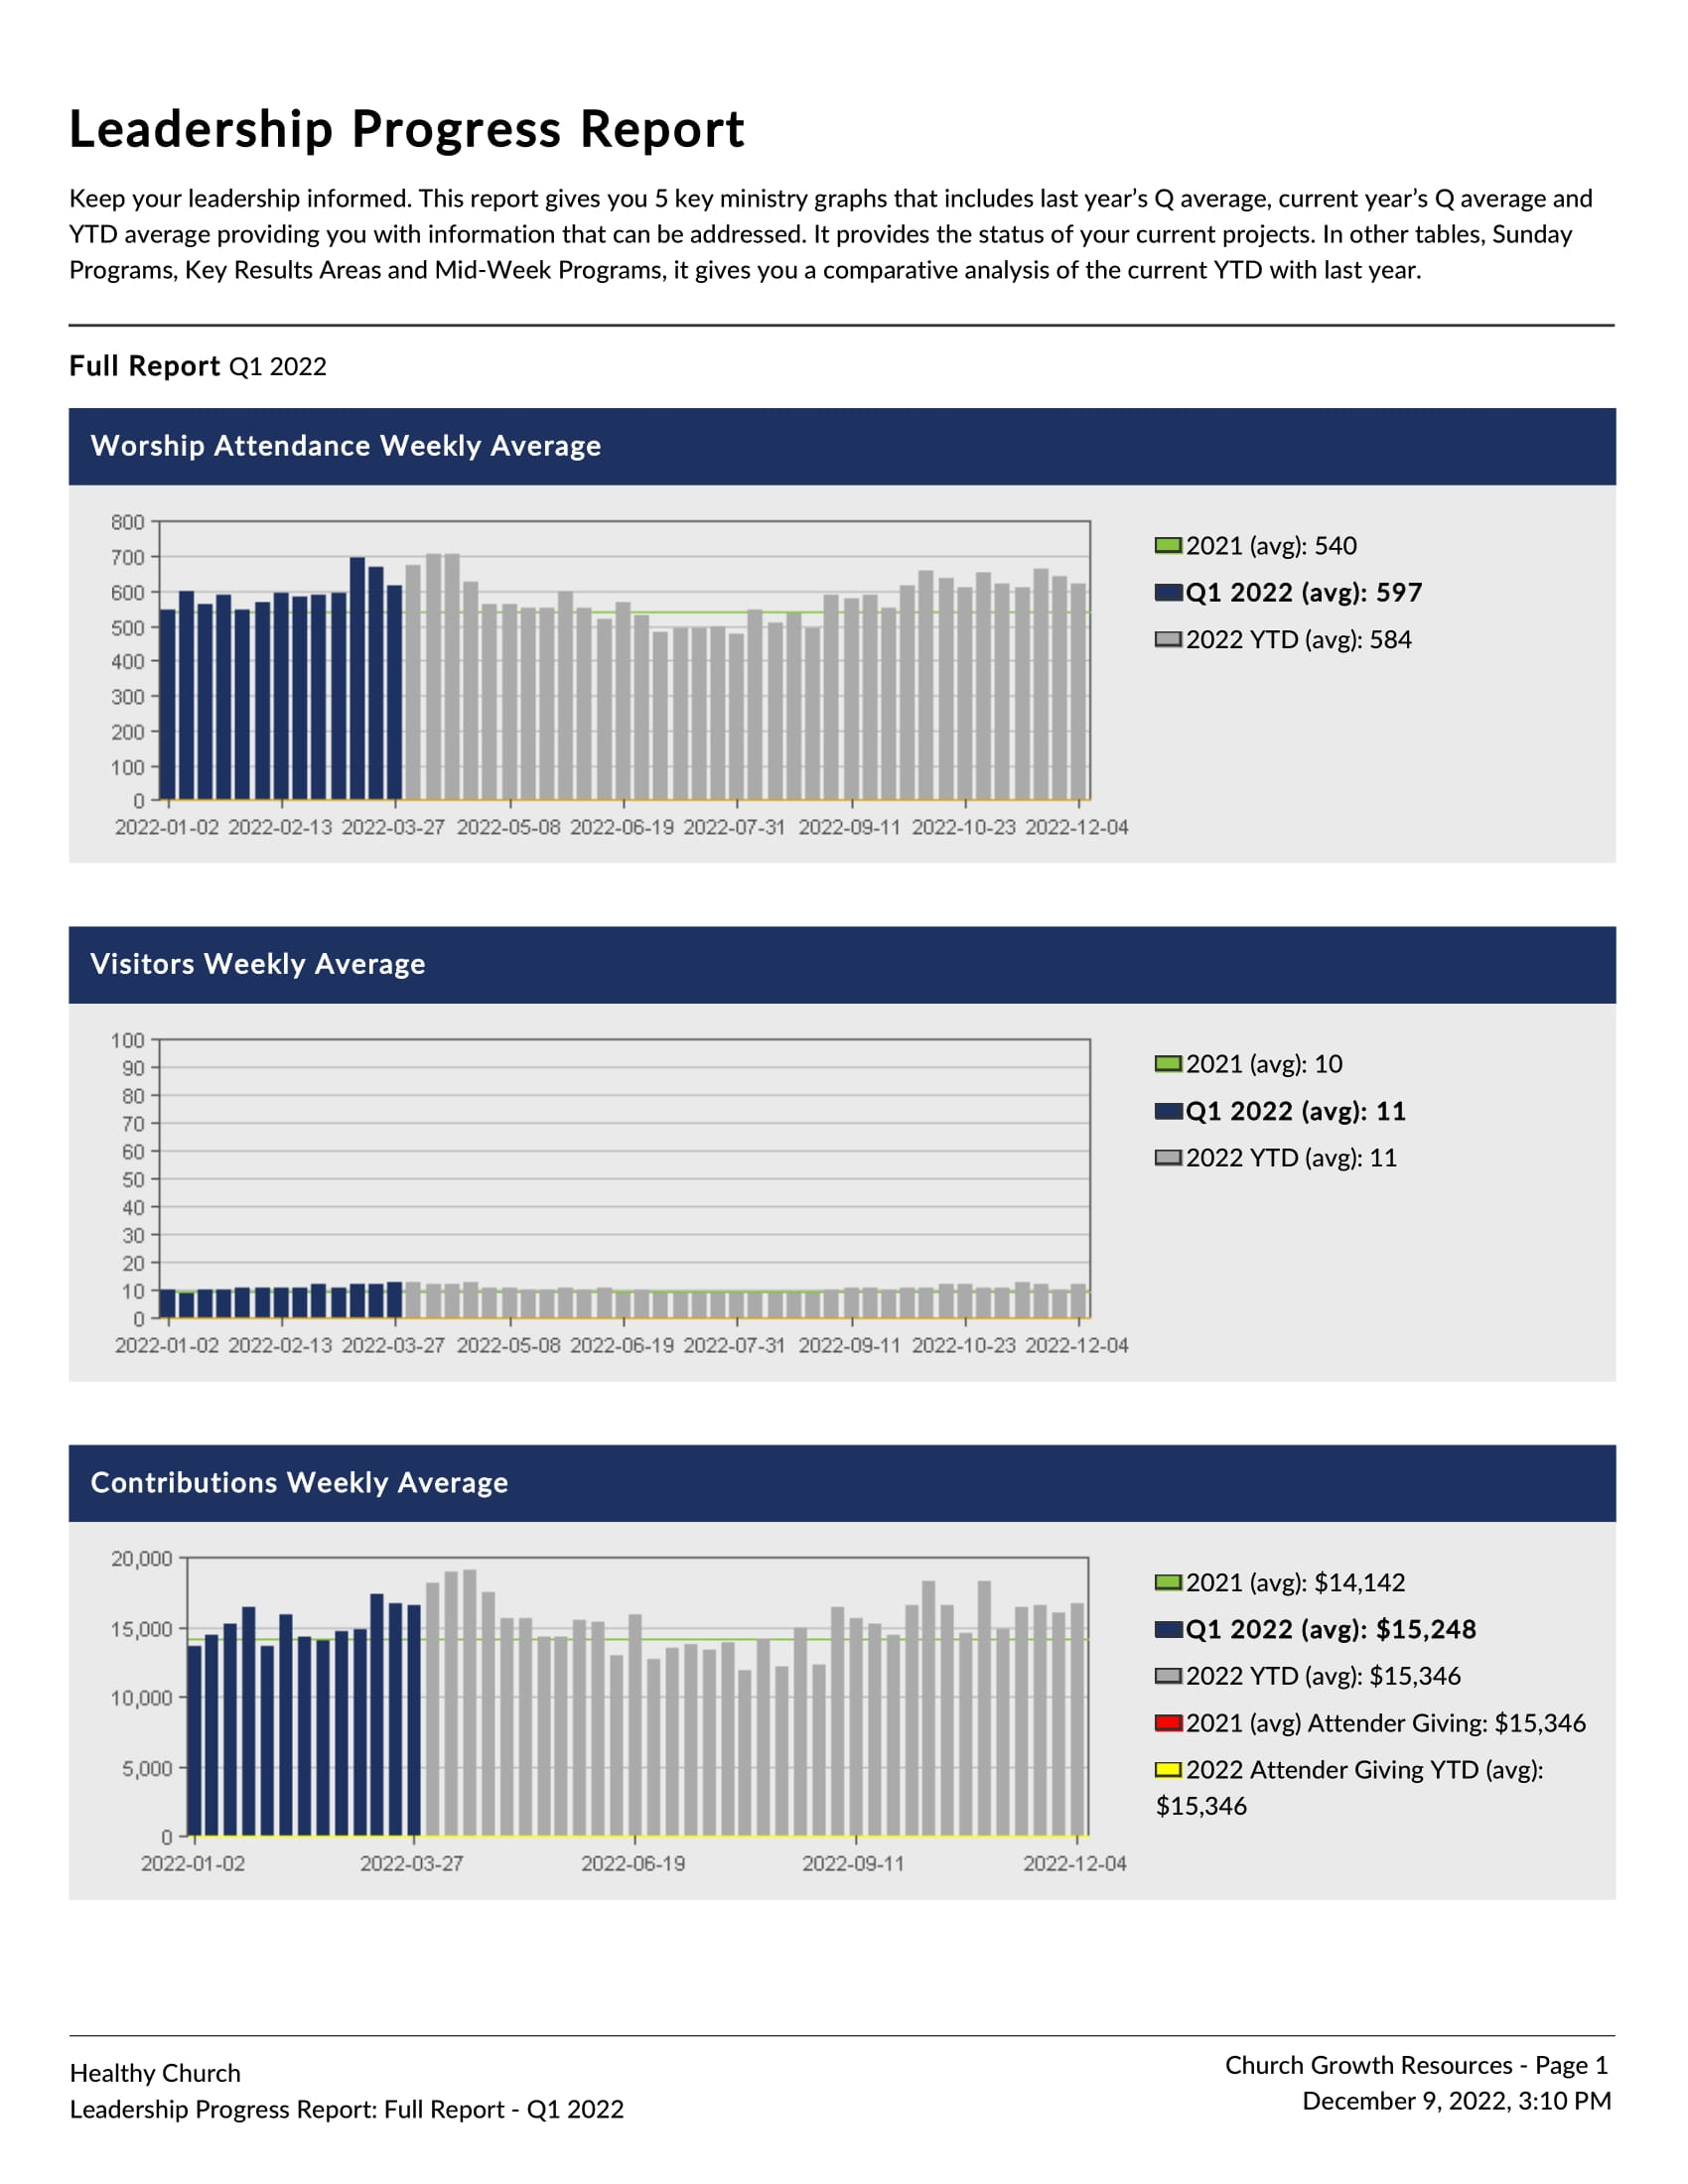
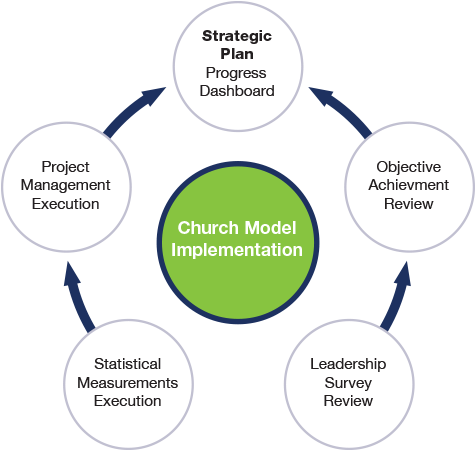
 Step Four: PerformanceProgress Dashboard
The Progress Dashboard combines all the collected critical data the church has inputted over a period of months and years, creating a series of updated graphs and reports.
Publish a progress dashboard with just a few clicks. No programming, just insights.
Create and save multiple dashboard views and use them for a designated purpose or a specific part of your leadership team. Create them once and use them again.
Healthy Church combines data from different Healthy Church reports to create a cross-functional comparative analysis.
Perform deep historical and predictive analysis to derive valuable insights. Visualize your data with a series of charts and graphs.
A quick way to review your progress in multiple areas of the church's ministry brought together on a few pages called the Progress Dashboard.
Click the links below to download expanded sample reports.