![]()
![]()
 Step Two: PerspectiveHealthy Church Statistics
It is remarkable to see church technology surge over the past decade. Websites and church management systems were once the luxury of large churches, but now they’re treated as fundamental necessities by even new church plants. And the underlying side-effect of these tools is data – deep reservoirs of data offering new ministry insights (perspective) and potential.
The Healthy Church provides a library of more than 30 ratios, statistical measurements or survey questions to assist you in understanding how effective you are in implementing the 6 New Testament purposes. The Healthy Church also allows you to gather attendance data for each of your church services and ministry programs. From the Healthy Church library of ratios and statistical measurements, the user can choose those measurements (options) that provide the best analysis for their church.
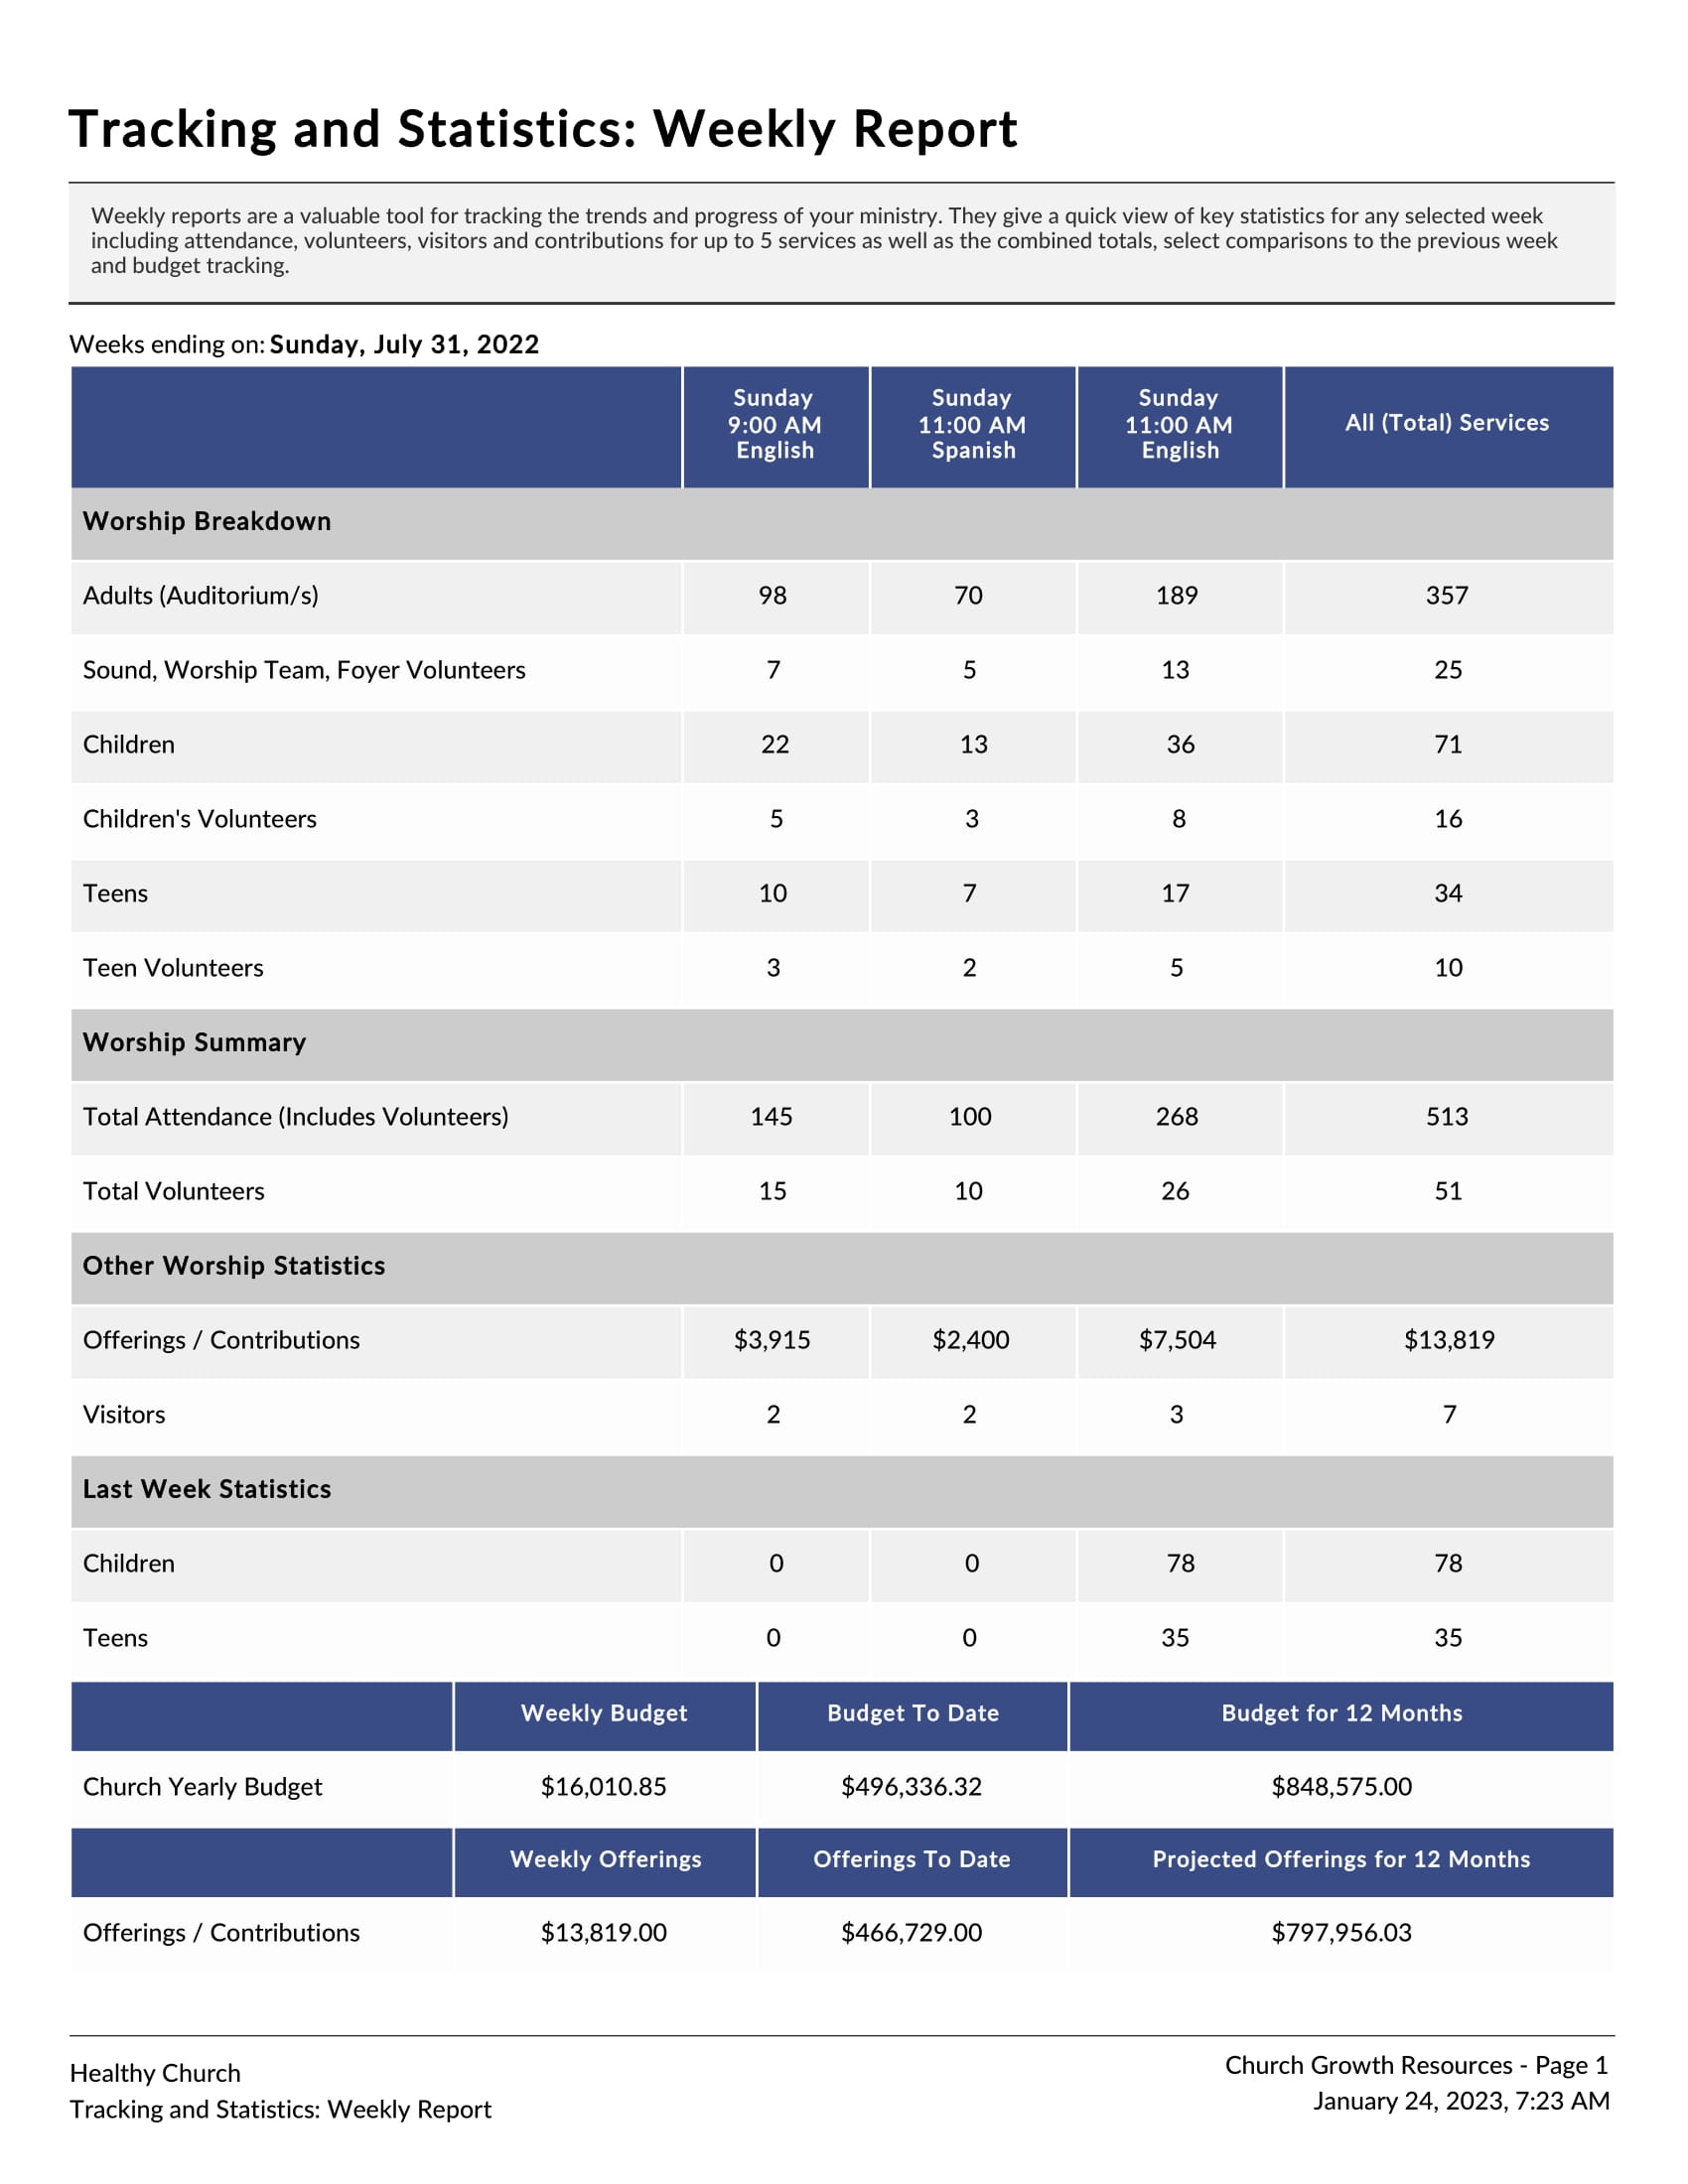
The Healthy Church provides a simple and effective method to input attendance, ratios and statistical measurements for your church service(s), programs, budgets, small groups and any other information you want to collect.
The Healthy Church provides weekly reports for your church service(s), ministry programs and monthly reports for all your key statistical measurements. This provides quick up-to-date information needed to make day-today decisions. The reports use the data inputted by the user and requires no additional inputting.
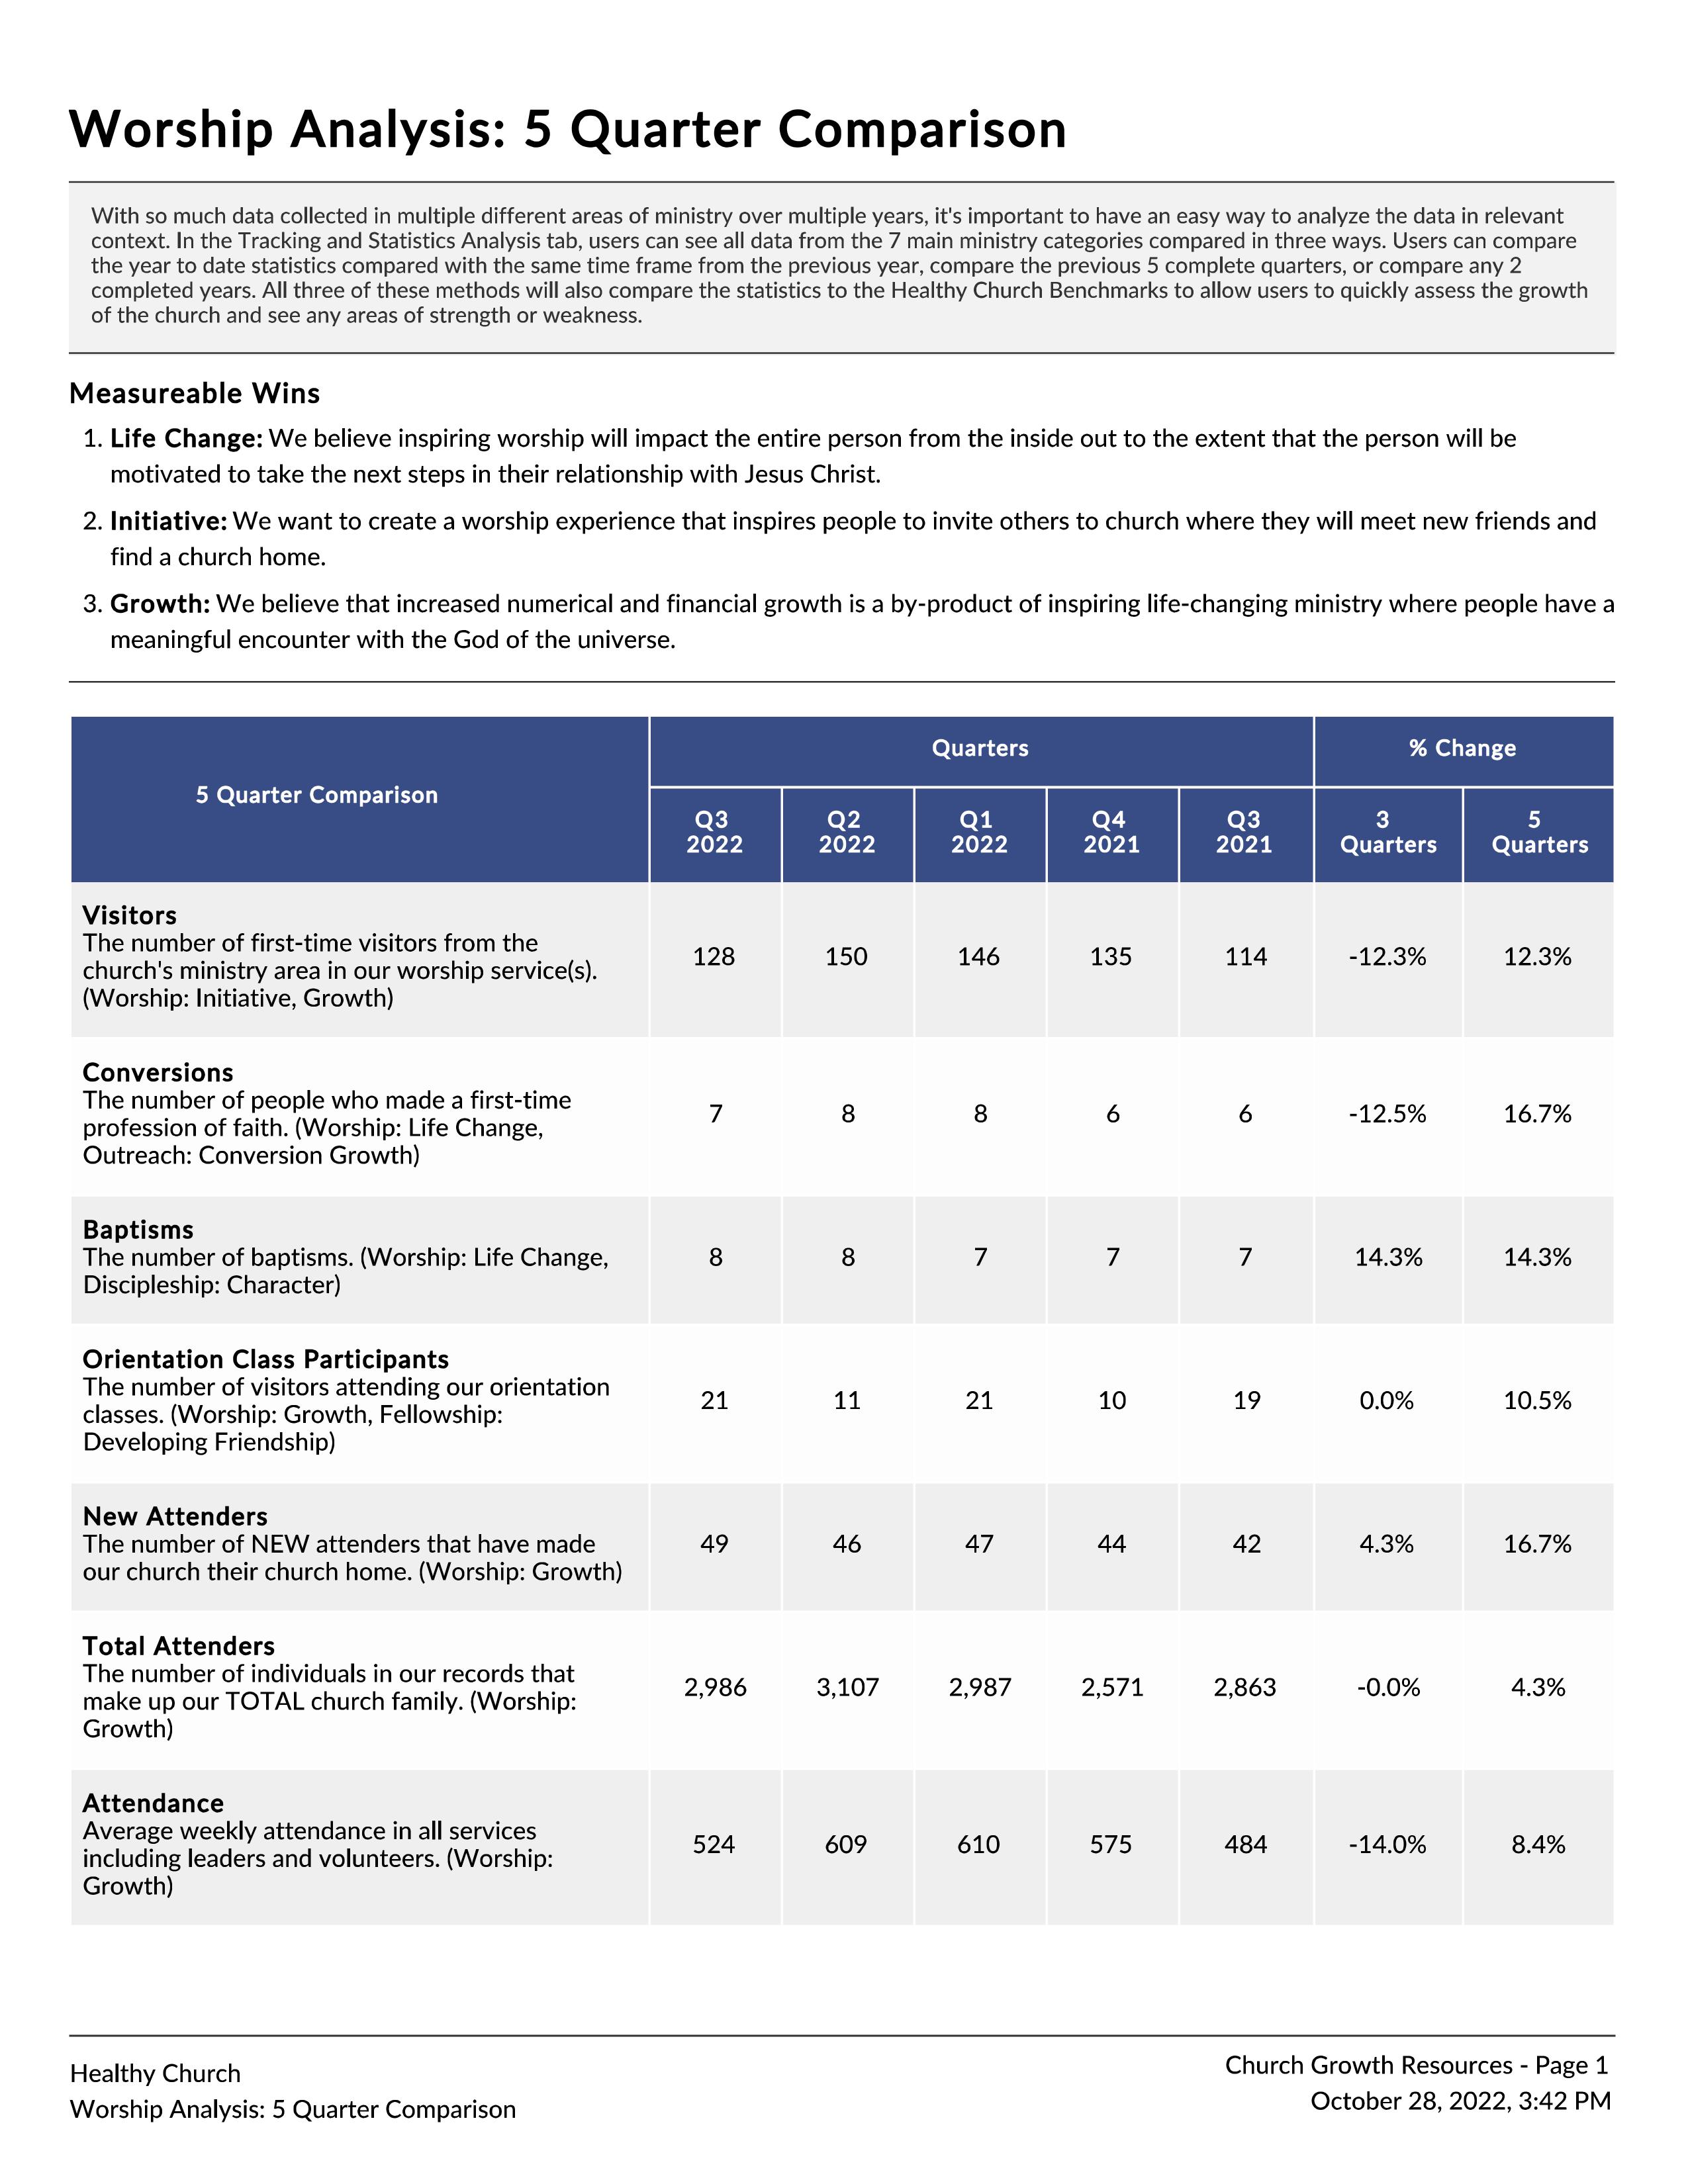
The Healthy Church Component Dashboards provides 3 reports for each of the 6 New Testament purposes. In each case, the Healthy Church spits out a Quarterly, 5 Quarter Trend and a 5 Year Trend report for each New Testament purpose.
The Quarterly Report provides a place for the target objective, a quarterly comparison between this year and last year and a YTD comparison between this year and last year and in each case a column for the Quarter and YTD % change.
The 5 Quarterly Trend provides a comparison of the past 5 ministry quarters and the 5 Year Trend provides a comparison of the past 5 years.
Data analytics is a process of (1) collecting (2) inputting, and (3) mining information to gain a better understanding of cultural and spiritual needs as well as gaining insight into how to run our spiritual race better. Keep in mind that metrics cannot measure heart attitude or spiritual fruit. Only God does that. Data analytics can, however, give us insights into the probability of such spiritual successes.